RF Group Delay Measurement: Methods, Setup, and Key Parameters

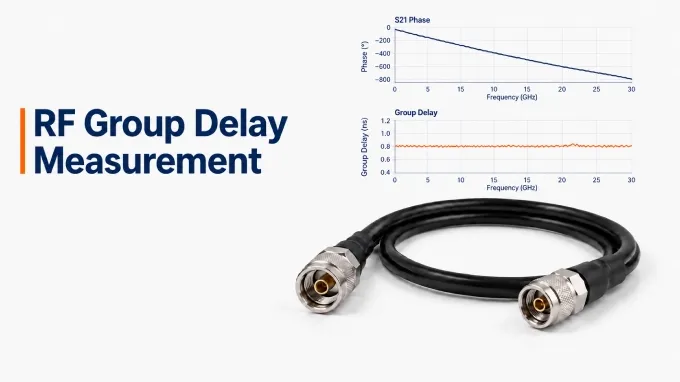
To measure RF group delay, use a calibrated vector network analyzer (VNA) to sweep the operating band of the device under test (DUT), measure its complex S21 response, and display the result in group-delay format. The analyzer calculates delay from the negative slope of transmission phase versus frequency. This method applies to filters, linear amplifiers, and custom RF cable assemblies.
Step 1: Prepare the RF Group Delay Test Setup
A typical VNA group delay test setup requires:
A two-port VNA: Frequency coverage and receiver dynamic range suitable for the DUT.
A compatible calibration kit or electronic calibration module: Correct connector interfaces and characterized standards covering the sweep.
Stable RF test cables and necessary adapters: Use precision test cable assemblies for VNA calibration. Confirm suitable impedance, frequency coverage, connector condition, and phase stability.
Any required fixture or bias hardware: Including DC blocks or receiver protection when the DUT and instrument require them.
The measurement path is:
VNA Port 1 → Input test cable → DUT → Output test cable → VNA Port 2
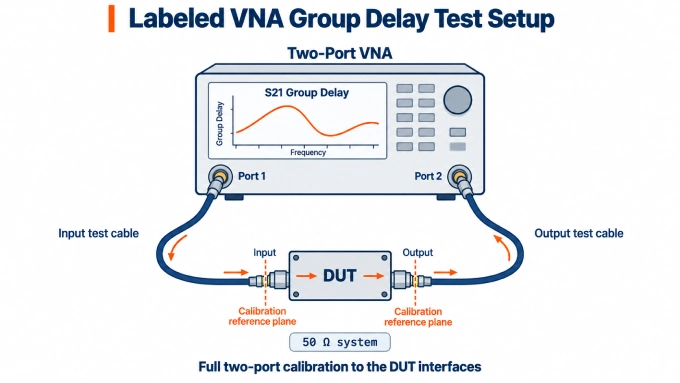
Use a consistent reference impedance, typically 50 Ω, throughout the setup. For a coaxial cable assembly under test, its connectors and cable normally remain part of the DUT. The separate cables connecting it to the VNA belong to the test setup.
Keep the assembly supported, respect its bend radius, and avoid connector strain.
Step 2: Configure the Sweep and Calibrate at the DUT Interfaces
Allow the VNA to complete its specified warm-up. Identify the frequency band over which the DUT must meet its delay requirement. Set a sweep that covers that band, with enough margin for the chosen aperture near its edges. Use enough sweep points to keep the true phase change between adjacent points below 180°, with practical margin.
Choose the source power, intermediate-frequency (IF) bandwidth, and averaging settings before calibration where practical. Narrowing IF bandwidth or averaging repeated measurements can reduce random noise. Both cost measurement time. For an amplifier, keep the test signal in its linear region. Account for gain and test-path losses when checking the power that will reach the VNA receiver.
Perform an appropriate full two-port calibration at the interfaces where the DUT will connect. Use the correct calibration-kit definitions and include the test cables and adapters that will remain in place. If a fixture separates the calibration planes from the required DUT planes, characterize and de-embed it or use a suitable calibration at the device interfaces.
Do not simply adjust electrical delay until the DUT reads zero. That removes a constant phase slope and can hide the absolute delay you intended to measure.
Before connecting the DUT, verify the calibration with an independently characterized thru or reference device. Compare its magnitude and delay with its expected response; a device with finite electrical length need not read zero delay.
Step 3: Connect the DUT and Display S21 and Group Delay
Before making connections, set the VNA RF output and, for an active DUT, the bias supplies to the safe states specified by the equipment manufacturers. Follow the DUT’s prescribed connection and bias sequence.
Connect the DUT without disturbing the calibrated test paths more than necessary. Inspect connector interfaces and apply the manufacturer’s specified mating torque. For an active DUT, protect the analyzer from prohibited DC or excessive RF power and allow the device to reach the intended operating condition. Account for any added protection components in the calibration or fixture model.
Select S21 and display its magnitude alongside phase and group delay. Use the VNA’s group-delay format for the calculation. The magnitude trace helps identify passbands, transmission nulls, and regions where the received signal may be too weak for reliable phase measurement.
Step 4: Check the Measurement and Save the Data
With the aperture set as described below, repeat the sweep to check stability. Then increase point density while keeping the aperture approximately constant in hertz and confirming that the calibration remains valid. The curves should converge as sampling improves.
Resolve significant differences or excessive noise before accepting the result. Check the calibration, connections, and DUT stability if the traces do not converge.
Save the S-parameters along with the frequency band, point count, aperture in hertz, IF bandwidth, source power, averaging and smoothing settings, calibration reference planes, and DUT operating conditions.
In Group Delay Measurement What Does The Term Aperture Refer to?
In group delay measurement, the term aperture refers to the frequency interval used to estimate the phase slope. Depending on the VNA, it may be specified in hertz, points, or a percentage of the sweep span.
A narrow aperture resolves finer delay features but makes the result more sensitive to phase noise. A wider aperture reduces noise while averaging over more of the response, potentially hiding narrow ripple or peaks.
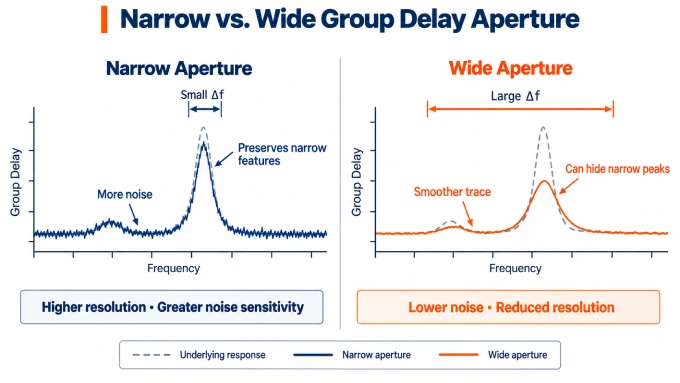
Point spacing and aperture are related but are not interchangeable. Increasing point count may narrow an aperture defined by a fixed number of points. Changing sweep span may change an aperture defined as a percentage.
Set the aperture required by the DUT specification. If none is given, choose one that resolves the relevant features while maintaining acceptable noise.
How to Calculate Group Delay From S-Parameters
Use the calibrated .s2p file saved in Step 4. Calculate the phase from complex S21, unwrap it, and differentiate using the actual frequency values and stated aperture. Do not differentiate a wrapped phase trace: its ±180° transitions produce artificial spikes.
Plot the calculated group delay against frequency. For a two-point calculation, place each value at the midpoint of the frequency interval used.
What Is the Formula for Group Delay?
For a two-port RF device, the group delay formula is:
Here, is the unwrapped S21 phase in radians, is frequency in hertz, and is delay in seconds. For discrete phase measurements in degrees, the practical approximation is:
Here, is the unwrapped phase change in degrees across the aperture, andis that aperture in hertz.
For example, a phase change of −18° across 10 MHz corresponds to approximately 5 ns of group delay over that interval. The minus sign converts the decreasing phase of an ordinary delay path into a positive delay.
How to Interpret the Group Delay Measurement
Interpret the curve together with S21 magnitude and phase, and distinguish absolute delay from in-band variation before comparing it with a requirement.
How to Read a Group Delay Plot
A group delay plot shows frequency on the horizontal axis and delay, usually in nanoseconds, on the vertical axis. Absolute group delay is the delay between the defined reference planes.
A relative-delay trace may have a constant offset removed. This can preserve the curve’s variation while discarding its absolute timing reference.
For a uniform cable with little dispersion, the approximate delay is its length divided by propagation velocity:
Here, is cable length in metres, is the speed of light in metres per second, and is velocity factor. As an illustrative estimate, 1 m of cable with a velocity factor of 0.80 has a delay of approximately 4.17 ns. Use this estimate as a plausibility check rather than a precision acceptance test.
How to Calculate Group Delay Variation
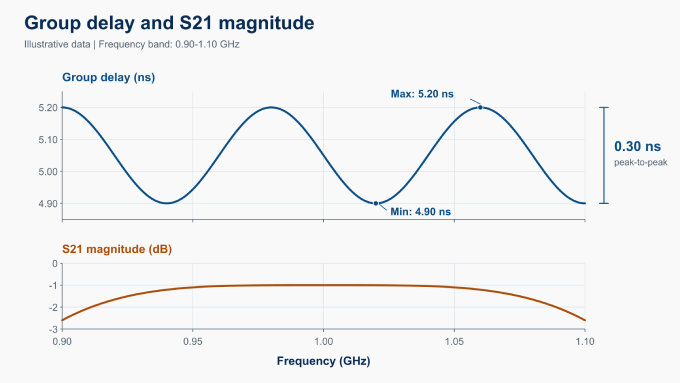
A common way to report in-band variation is the maximum delay minus the minimum delay. Calculate both values across the specified frequency band:
For example, a curve spanning 4.9 ns to 5.2 ns has 0.3 ns peak-to-peak variation.
Do not automatically call this “±0.15 ns about the average.” Half the peak-to-peak range is referenced to the midpoint of the extremes, which may differ from the mean.
State the frequency band, aperture, and any smoothing, averaging, or trend-removal method used. Without these conditions, variation values from different measurements may not be directly comparable.
Group Delay in RF Filters
Evaluate group delay variation across the filter’s specified passband. A peak near a filter’s passband edge may be part of its designed response.
Large excursions in a deep filter stopband or transmission null may reflect phase-measurement noise as S21 approaches the receiver noise floor. At an exact transmission zero, S21 phase—and therefore its phase-derived group delay—is undefined.
A group-delay equalizer is a filter used to reduce delay variation; it is different from smoothing the VNA trace.
FAQ
Discussion (0)
Be the first to comment.