How to Measure RF Switch Isolation: VNA Setup and Test Procedure
Measure RF switch isolation using a VNA. Learn S21 testing, port terminations, calibration, dynamic range, leakage errors, and reporting procedures.

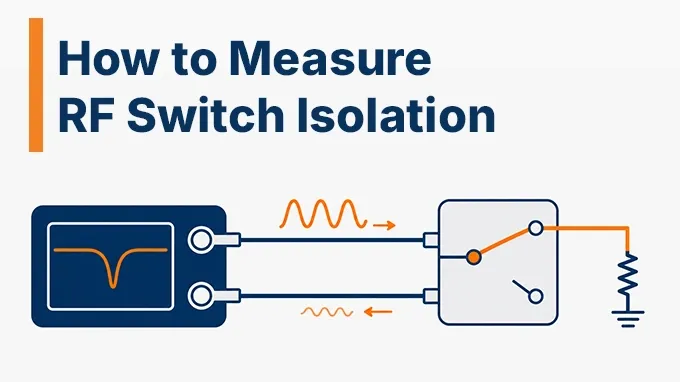
RF switch isolation measures how effectively a switch suppresses signal leakage through an inactive RF path. It is usually determined by measuring the OFF-state transmission coefficient, S21, with a vector network analyzer (VNA).
Obtaining a trustworthy result, however, requires more than connecting two test cables. The switch state, unused-port terminations, calibration reference planes, and measurement dynamic range all affect the reading. This guide provides a repeatable RF switch isolation test procedure, from configuring the equipment to evaluating the results against a datasheet specification.
What Is RF Switch Isolation and How Is It Measured?
RF switch isolation is the attenuation between two specified RF ports when the signal path between them is inactive. It is expressed as a positive value in decibels (dB), with higher values indicating less leakage.
A VNA measures the complex transmission coefficient between its source and receiver ports. For an OFF-state path connected from VNA Port 1 to Port 2:
Because a VNA commonly displays the transmission magnitude as , an S21 reading of −70 dB corresponds to 70 dB isolation.
The measurement must identify which switch ports are involved and which paths are active. For an explanation of the underlying switching states and architectures, see RF switch operation.
Common-to-OFF-Port vs. Port-to-Port Isolation
Consider a single-pole double-throw (SPDT) switch with three RF ports:
RFC: Common RF port
RF1: First selectable port
RF2: Second selectable port
When RFC is connected to RF1, the RFC-to-RF2 path is OFF.
Two different isolation measurements are possible:
Measurement | Port Pair | Switch State |
Common-to-OFF isolation | RFC ↔ RF2 | RFC connected to RF1 |
Throw-to-throw isolation | RF1 ↔ RF2 | RFC connected to RF1 |
These measurements are not interchangeable.
In a transmit/receive system, for example, leakage between transmitter and receiver ports may depend on throw-to-throw isolation rather than only common-to-OFF isolation. The appropriate measurement must match the path and control state specified in the datasheet.
What Equipment Is Needed for RF Switch Isolation Measurement?
An accurate measurement requires equipment capable of detecting leakage well below the applied RF signal level.
Equipment | Requirement |
Two-port VNA | Frequency coverage and sufficient transmission dynamic range |
RF test cables | Stable, shielded, and compatible with the test frequency |
Calibration kit or ECal | Compatible with the connector interfaces and reference impedance |
50 Ω terminations | Broadband matched loads for unused ports |
DC supply or switch controller | Correct bias and control-state selection |
Adapters or test fixture | Characterized RF interfaces where required |
Connector inspection tools | Cleanliness and mechanically sound connections |
For coaxial laboratory setups, 50 Ω is the usual reference impedance. Other systems require their specified impedance.
The VNA must offer sufficient usable dynamic range at the selected source power, IF bandwidth, and averaging settings. A quoted instrument dynamic range is not automatically the dynamic range available in the completed test setup.
Before connecting the RF Switch, verify its control voltage, RF power limits, connector interfaces, and required operating state.
Disable external RF sources and avoid applying uncontrolled DC or RF power to the VNA receivers.
How Should You Configure the RF Switch and VNA for Isolation Testing?
The connection arrangement determines which S-parameter is actually measured.
Measuring Common-to-OFF-Port Isolation
For an SPDT switch, configure the setup as follows:
VNA Port 1 ───── RFC
│
SPDT Switch
/ \
RF1 RF2 ───── VNA Port 2
│
50 Ω Load
Set the switch to connect RFC to RF1.
In this configuration:
VNA Port 1 drives the common port.
VNA Port 2 measures leakage reaching RF2.
RF1, the selected path, is terminated with 50 Ω.
S21 represents common-to-OFF-port transmission.
The VNA receiver presents its calibrated reference impedance at RF2, subject to its residual port-match error. To characterize the other OFF path, change the switch state, exchange the RF1/RF2 connections as appropriate, and repeat the measurement.
Measuring Throw-to-Throw Isolation
For isolation between RF1 and RF2, connect VNA Port 1 to RF1 and VNA Port 2 to RF2.
Terminate RFC with a suitable 50 Ω load and select the specified switch state. This measures the leakage between the two throw ports under matched common-port conditions. In either configuration, all remaining accessible RF ports should be terminated according to the test specification.
Absorptive vs. Reflective Switches
An absorptive switch provides internal matched terminations at designated inactive ports. A reflective switch generally presents an open- or short-like impedance at those ports.
Do not confuse internal OFF-port termination behavior with external VNA port termination. A reflective switch can still be measured in a 50 Ω S-parameter environment. Connecting the VNA receiver to its inactive port does not change the switch into an absorptive design.
For either type, follow the manufacturer's port-state diagram and termination requirements.
How to Calibrate the VNA Before Measuring RF Switch Isolation
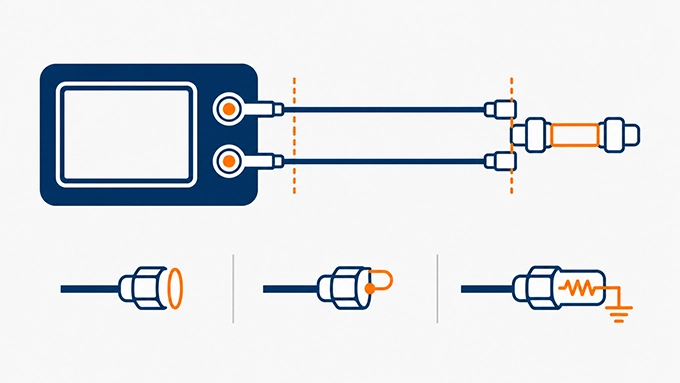
Calibration removes systematic measurement errors associated with the analyzer and the calibrated test paths.
For switch isolation measurements, the most important distinction is between an ordinary two-port calibration and an additional isolation-error correction.
Establish the Calibration Reference Planes
The reference planes should be located at the interfaces where the switch under test will connect.
For a coaxial setup, leave the measurement cables and required adapters installed during calibration. This allows the calibration to account for their transmission tracking and mismatch contributions. If the switch is mounted on a PCB fixture, use a validated fixture calibration or de-embedding approach when the required reference planes are at the device terminals. Otherwise, the result includes the fixture's RF behavior.
Perform a Full Two-Port Calibration
Configure the measurement frequency range, reference impedance, source power, and other relevant settings before calibration.
For a conventional coaxial VNA setup, use an appropriate full two-port SOLT calibration or compatible electronic calibration procedure. A full two-port calibration corrects major systematic errors associated with transmission tracking, reflection tracking, source and load match, and directivity.
A simple thru-response normalization can remove transmission tracking errors, but it does not provide the same mismatch correction as a full two-port calibration.
After calibration:
Confirm that correction is active.
Verify the calibrated thru response or use an independent verification device.
Avoid disturbing the test cables and adapters.
Preserve the calibrated frequency range and relevant instrument settings.
For additional background on reference planes and VNA calibration, see the related reflection-measurement guide. Unlike a one-port VSWR measurement, this procedure requires calibrated transmission between two RF interfaces.
Is an Additional Isolation Calibration Necessary?
Not always.
Some VNAs support an isolation or crosstalk calibration that measures leakage between the instrument's source and receiver paths while the test interfaces are terminated. This correction can help when testing extremely high-isolation devices or fixtures with significant electromagnetic coupling. However, if the crosstalk is already below the receiver noise floor, isolation correction may introduce additional noise rather than improve accuracy.
Keysight documentation identifies this as an important limitation, particularly for very high rejection measurements. Use the additional isolation correction only when the instrument supports it and the measured setup requires it.
When performing the correction, follow the manufacturer's instructions for matched loads, IF bandwidth, averaging, and receiver configuration. Avoid changing the source power or receiver attenuation range after calibration unless the VNA's calibration procedure permits it. If these settings must change, verify whether recalibration is required.
How to Measure RF Switch Isolation Using a VNA: Step-by-Step Procedure
The following example measures common-to-OFF-port isolation of an SPDT switch over 2–6 GHz. The numerical settings are illustrative and must be adapted to the device and instrument specifications.
Step 1: Configure the Measurement
Set the VNA to measure S21 in logarithmic magnitude format. An example configuration is:
Setting | Example Value |
Frequency range | 2–6 GHz |
Measurement | S21 Log Magnitude |
Source power | −10 dBm |
Sweep points | 1601 |
IF bandwidth | 10 Hz |
Sweep averaging | 8 sweeps |
Reference impedance | 50 Ω |
A narrow IF bandwidth reduces receiver noise but increases measurement time.
Select a source power that provides adequate receiver signal without exceeding the switch's operating limits or causing unwanted nonlinear behavior.
Step 2: Establish the Measurement Floor
Before connecting the switch, measure the residual transmission with the two calibrated test interfaces separately terminated in suitable 50 Ω loads.
Keep the cables in a representative physical arrangement. This measurement reveals the combined effects of receiver noise and residual coupling through the measurement setup. Record the baseline across the frequency range. A baseline trace that changes significantly with cable positioning or fixture separation suggests electromagnetic leakage rather than purely random receiver noise.
The terminated-port baseline is a useful diagnostic, but it does not necessarily reproduce every leakage path present when the actual DUT is installed.
Step 3: Verify the ON-State Path
Connect the VNA between RFC and RF2, with RF1 externally terminated.
Command the switch to connect RFC to RF2. The measured S21 should now represent the selected path's insertion loss. Confirm that the response is consistent with the expected ON-state transmission. This check identifies incorrect control states, swapped ports, disconnected cables, and gross fixture faults before attempting a high-isolation measurement.
Step 4: Select the OFF State
Without changing the RF connections, command the switch to connect RFC to RF1.
The RFC-to-RF2 path is now inactive. Allow the switch and control circuitry to reach their specified settled state. For latching or failsafe switches, verify the actual operating state rather than assuming that removing control power produces a particular connection.
Step 5: Measure and Record OFF-State S21
Run the frequency sweep with the calibrated correction active. Allow the configured averaging to complete before recording the trace.
Inspect the entire response for:
Frequency-dependent isolation degradation
Unexpected resonances or leakage peaks
Noise-like fluctuations near the measurement floor
Differences between repeated sweeps
Record the least-negative S21 value, which represents the lowest isolation across the band. Do not use smoothing to conceal narrow leakage peaks.
Step 6: Repeat for the Required Port Paths
Repeat the test for the other common-to-OFF path and any required throw-to-throw isolation paths.
Maintain consistent terminations, cable placement, bias conditions, and instrument settings. Save the traces and measurement configuration for reporting. For multiport switches or switch matrices, a port-state test matrix is useful to ensure every required isolated path is covered.
How to Calculate and Interpret RF Switch Isolation from S21
The VNA generally presents OFF-state S21 as a negative dB value. Convert it to positive isolation using:
For example:
Frequency | Measured S21 | Isolation |
2 GHz | −94 dB | 94 dB |
4 GHz | −88 dB | 88 dB |
6 GHz | −83 dB | 83 dB |
These are hypothetical results from one defined OFF-state path.
The minimum measured isolation across the three listed points is 83 dB. A complete acceptance decision must consider every measured frequency within the specified band.
Comparing the Result With the Datasheet
Suppose the specification requires:
Minimum isolation: 80 dB from 2 to 6 GHz.
Equivalently, the OFF-state S21 magnitude must not exceed −80 dB anywhere in the specified band. If the worst measured result over the complete sweep is −83 dB, the nominal margin is:
Assume the laboratory has established an applicable expanded measurement uncertainty of 1.5 dB for the worst-case result. Under an agreed guard-banded acceptance rule:
The result satisfies the 80 dB requirement with that uncertainty allowance. The 1.5 dB value is illustrative; uncertainty must be established for the actual measurement configuration.
What Factors Affect RF Switch Isolation Measurement Accuracy?
High-isolation measurements are particularly sensitive to weak-signal errors.
VNA Dynamic Range and Noise Floor
Suppose the worst observed S21 baseline is −108 dB and the DUT measures −83 dB. The separation is:
The measured signal is therefore 25 dB above the observed baseline at the limiting frequency, assuming the traces are compared under identical relevant settings. This provides useful measurement headroom.
If the DUT trace approaches the baseline, however, it becomes difficult to distinguish actual switch leakage from measurement-system noise or crosstalk. A result indistinguishable from the measurement floor should not be reported as an exact isolation value. Instead, report an appropriately qualified lower bound supported by the characterized measurement capability.
Reducing IF bandwidth or increasing averaging can improve noise-limited sensitivity, but neither technique removes stable electromagnetic crosstalk.
Fixture and Cable Leakage
Leakage can bypass the switch through nearby cables, PCB traces, connector interfaces, or insufficiently shielded fixtures.
At very high isolation levels, even small external coupling paths may dominate the measured response. Keep test cables separated where practical, avoid unnecessary parallel cable runs, and preserve the fixture geometry. If changing cable position changes the measured isolation significantly, investigate the setup before attributing the result to the switch.
Termination and Mismatch Errors
Isolation is normally characterized with specified reference impedances at the relevant ports.
Poorly matched loads can create reflections that modify the observed leakage. This effect is especially important for switches connected to antennas, amplifiers, or filters that do not present ideal 50 Ω impedances. A calibrated 50 Ω isolation result is therefore not necessarily equal to the leakage observed in an installed system with arbitrary complex loads.
Analog Devices' AN-2558 demonstrates that load magnitude and phase can change RF switch isolation appreciably.
Calibration Drift and Repeatability
Cable movement, connector remating, temperature changes, and instrument drift can affect measurement accuracy. Repeat the measurement after controlled reconnection when connector repeatability matters.
For formal verification, include calibration uncertainty, residual coupling, trace noise, mismatch, drift, and connector repeatability in the uncertainty assessment as applicable.
What Should an RF Switch Isolation Test Report Include?
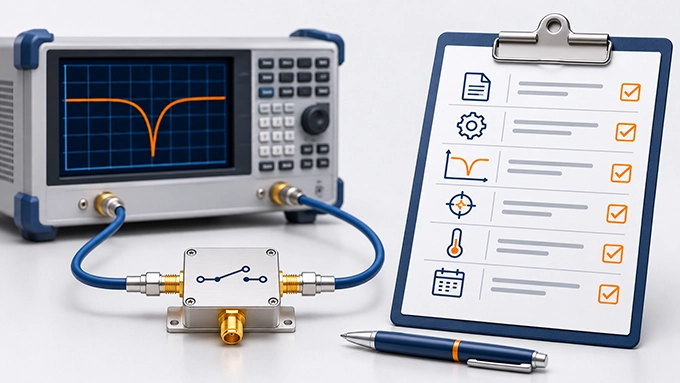
A reproducible test report must identify both the measured RF response and the conditions under which it was obtained.
Report Item | Required Information |
DUT identification | Part number, serial number, revision |
RF paths | Source port, receive port, terminated ports |
Switch state | Control setting and confirmed connection |
Test conditions | Frequency, bias, temperature, source power |
Calibration | Method, reference planes, verification status |
VNA configuration | IF bandwidth, averaging, sweep points |
Dynamic range | Baseline measurement and usable margin |
Results | Worst-case isolation and frequency |
Specification | Applicable minimum isolation limit |
Evaluation | Uncertainty, acceptance rule, disposition |
Termination details | Load impedance, terminated ports, load model, and rated frequency range |
VNA identification | Manufacturer, model, serial number, and firmware version |
Include the S21 trace, preferably as numerical data and a clearly labeled plot. When the result is limited by the setup floor, document that limitation explicitly. If different paths have different requirements, report them separately rather than combining all measurements into one minimum-isolation figure.
FAQ
Discussion (0)
Be the first to comment.