What Is RF Amplifier Saturation? Psat, P1dB, and Operating Limits

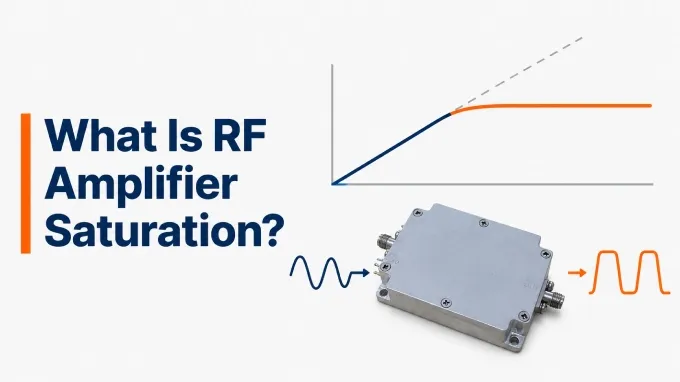
RF amplifier saturation occurs when increasing input power produces little additional RF output power. The output power measured in this condition is called saturated output power, or Psat, and is specified under defined test conditions.
Saturation can occur in RF amplifiers used as receiver gain stages, drivers, and transmitter power amplifiers. A Psat rating describes output capability; it does not guarantee that the amplifier can deliver that power while preserving the required signal fidelity. The appropriate operating level depends on the waveform and the system’s distortion limits.
RF Amplifier Saturation Explained Using a Saturation Curve Diagram
An amplifier saturation curve shows how output power changes as input power increases. Read input power along the horizontal axis and output power along the vertical axis; both are expressed in dBm.
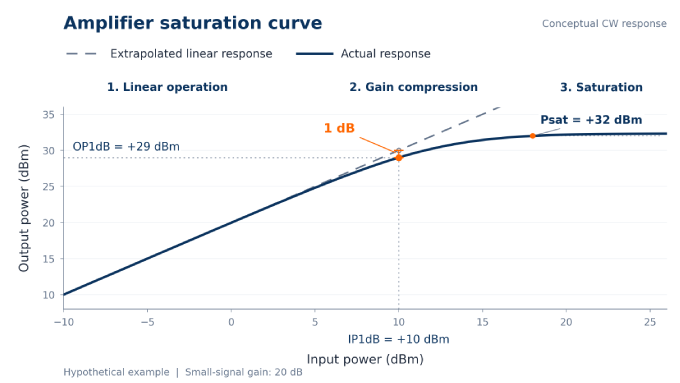
The dashed line represents the output predicted by the amplifier’s small-signal gain. Compare the solid curve with this reference as you move from left to right:
Linear operation: The solid curve follows the dashed reference. A 1 dB input increase produces approximately 1 dB more output, so gain remains nearly constant.
Gain compression: The solid curve bends below the reference. Output power continues to rise, but each additional decibel of input produces less additional output.
Saturation: The solid curve becomes nearly flat as the amplifier approaches its available voltage or current limits. Additional drive produces little additional output.
The nearly flat slope does not mean power gain is zero: output power can still be substantially greater than input power.
What Is Saturated Output Power (Psat)?
Saturated output power (Psat) is the RF output power an amplifier delivers when further increases in input power produce little additional output. It is normally expressed in dBm or watts and describes the output level, not the input power needed to reach saturation.
On the diagram, read Psat on the vertical axis at the marked saturation condition near the flattened part of the solid curve. A perfectly horizontal response is not always required: manufacturers may define saturation using a specified small output increase for an additional increase in input.
The rating applies under stated frequency, bias, load, temperature, and waveform conditions. It indicates saturated power capability, rather than the power available while meeting a particular distortion requirement.
What Is the 1 dB Compression Point on the Curve?
Find the operating point where the solid curve lies 1 dB below the dashed reference. At this input level, the amplifier’s gain is 1 dB below its extrapolated small-signal gain. This is the 1 dB compression point, and it has two power coordinates:
IP1dB: Project the operating point onto the horizontal axis to read its input power.
OP1dB: Project the same point onto the vertical axis to read its actual output power. Use the solid curve, not the dashed prediction.
P1dB therefore marks a specified gain reduction before the curve reaches saturation. The gap between OP1dB and Psat depends on the amplifier and operating conditions; there is no universal decibel offset between them.
P1dB also does not identify where all distortion begins. Harmonics, intermodulation products, and amplitude-dependent phase shifts can occur below it, even when the power curve still appears almost straight.
Amplifier Compression vs Saturation
An amplifier can be compressed without being saturated. Gain compression means its gain has fallen below the small-signal reference. Saturation describes the region where additional input power produces little further output. It generally represents a strongly compressed condition rather than a separate physical effect.
Comparison | Gain Compression | Saturation |
Response to additional drive | Output can still increase appreciably, although less than the linear prediction | Output approaches a plateau and changes little with further drive |
Quantity reported | Gain reduction, expressed in dB | Saturated output power, Psat, expressed in dBm or watts |
Reference used | A stated reduction from small-signal gain, such as 1 dB | The saturation criterion declared for the device |
This distinction matters when interpreting measurements. A gain reduction of 1 dB establishes the P1dB operating point; it does not establish that the amplifier has reached its maximum output capability. Likewise, a Psat value does not reveal how gradually the amplifier compresses as it approaches that level.
What Are the Signs of RF Amplifier Saturation in a Receiver Chain?
Reduced wanted-signal gain or sensitivity in the presence of a strong blocker can indicate low noise amplifier saturation. However, similar symptoms can originate in a later amplifier, mixer, or ADC. They do not, by themselves, establish that the LNA has reached Psat.
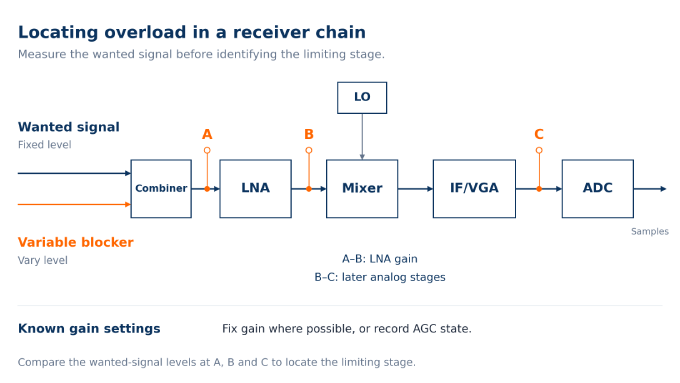
For a controlled check, hold the wanted-signal input constant. Fix receiver gain settings where possible, or record the AGC state. Then vary the blocker level and compare the wanted signal before and after the suspected stage.
Symptom | Possible Explanation | Confirmation Check |
Wanted-signal gain decreases as the blocker rises | A gain stage is compressing | Measure the wanted signal separately from the blocker; total received power can conceal its gain reduction. |
Reception or demodulation deteriorates | The receiver is becoming desensitized | Compare SNR or error rate with and without the blocker at the same wanted-signal input. |
Spurs or distorted waveforms appear | An amplifier, mixer, ADC, or measuring instrument is becoming nonlinear | Check where distortion first appears and whether it exists before the ADC. |
Gain or sensitivity recovers slowly after the blocker disappears | Overdrive recovery or control-loop settling is delaying reception | Record recovery alongside the AGC state to distinguish the two effects. |
AGC can deliberately flatten the receiver’s level response, while excessive front-end gain can overload a downstream stage without saturating the LNA. Intermodulation can also appear before substantial gain compression. Treat spurs, high RSSI, or poor reception as clues; locate the limiting stage and confirm its power response before attributing the problem to saturation.
How Do You Measure P1dB and Psat?
Measure P1dB and Psat by sweeping input power at a fixed frequency, measuring output power, and comparing the resulting gain with the amplifier’s small-signal gain.
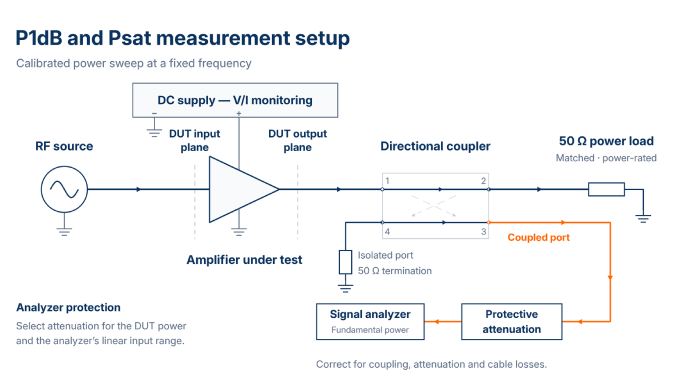
Set the operating conditions. Specify frequency, supply voltage, bias, load, temperature, and waveform. For pulsed measurements, define pulse width, duty cycle, and measurement timing.
Establish the reference planes. Calibrate input power at the DUT plane and correct output readings for coupling, attenuation, and cable losses. State whether the reported output includes only the fundamental frequency or a broader range.
Measure the baseline gain. Begin at low drive and verify that calculated gain remains approximately constant over a small input-power range.
Sweep input power. Increase drive in controlled steps, record input and output powers, and calculate compression using the earlier equations. Verify that the source delivers the intended input power and allow readings to settle.
Identify the operating points. Record IP1dB and OP1dB at 1 dB compression, then determine Psat using the declared criterion. Stay within permitted operating limits. If available drive or device limits prevent reaching the criterion, report that limitation.
Validate and report. Check that the analyzer remains linear by reducing its input level while holding DUT drive constant; corrected output readings should remain consistent within measurement uncertainty. Repeat across the required conditions and report the uncertainty and power-step resolution.
Use the specified load when comparing measurements with a datasheet. Small-signal RF amplifier output impedance alone does not identify the optimum large-signal load; determining that load requires suitable large-signal characterization.
Can You Calculate RF Amplifier Saturation Power From Gain or P1dB?
You cannot determine Psat from small-signal gain or P1dB alone. Obtain it from applicable datasheet values, a measured power curve, or a validated nonlinear model.
The useful calculations describe the extrapolated linear output and measured gain compression. Here, G₀ is small-signal gain and C is compression. Express power levels in dBm and gain or compression in dB:
The subtraction of 1 dB in the P1dB formula accounts for the gain reduction already present at that operating point.
Consider a hypothetical amplifier with 20 dB small-signal gain. At +10 dBm input, it delivers +29 dBm actual output:
Its IP1dB is therefore +10 dBm, and its OP1dB is +29 dBm. The linear prediction provides a reference; it does not describe the actual output once compression develops.
If a separate saturation measurement gives Psat = +32 dBm, that is an additional result—not a value derived from these equations.
How Should You Interpret Psat in an RF Amplifier Datasheet?
Read Psat together with its definition, test conditions, and guarantee status. Check these five items before comparing it with another amplifier’s rating:
Definition: Find the footnote specifying the saturation criterion. A slope criterion, specified input drive, or gain-compression level can lead to different quoted values.
Conditions: Check frequency, supply voltage, bias, temperature, and load. For pulsed ratings, also check pulse width and duty cycle; do not assume the same output is available continuously.
Guarantee status: Distinguish typical values and characterization curves from guaranteed minimum performance under the stated conditions.
Power reference: Identify whether output power is referenced to device pins, a module connector, or another measurement plane. Check whether it includes only the fundamental frequency or also harmonics.
Related ratings: Keep Psat separate from OP1dB, maximum permitted RF input power, DC consumption, and efficiency measured at a particular operating point.
For example, a datasheet may give these typical values at 10 GHz, +25°C, and a +7 V supply:
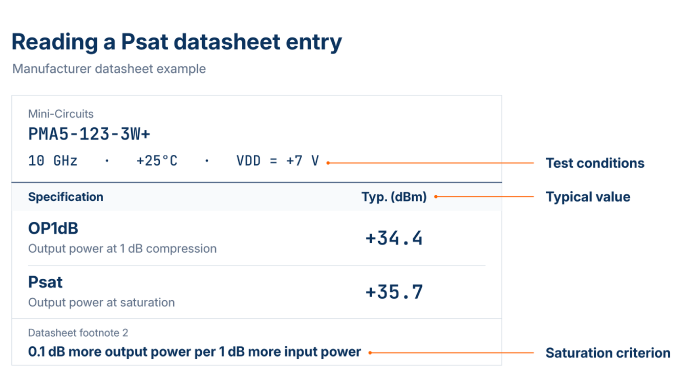
Its saturation footnote specifies 0.1 dB additional output per 1 dB additional input.
How Should You Choose Between Linear and Saturated Operation?
Choose the operating region that delivers the required output power while meeting waveform fidelity and spectral limits. Evaluate efficiency within those constraints: the most efficient operating point is useful only if the resulting signal meets the system’s performance requirements.
How Does Power Amplifier Saturation Affect Efficiency and Linearity?
Driving a conventional fixed-bias PA harder often improves efficiency up to a device-dependent optimum, while increasing compression and distortion. Backing off usually improves linearity but reduces the proportion of DC power converted into RF output.
Two efficiency measures distinguish how power is accounted for. Drain efficiency compares RF output with DC drain-supply power:
Power-added efficiency (PAE) subtracts the RF input power and compares the power added by the amplifier with its total DC input:
Use linear power units, such as watts, under consistent operating conditions. For a stage powered only by its drain supply, the two DC denominators are identical.
Peak efficiency need not coincide with the published Psat point. Further overdrive may add little output while increasing input power or DC consumption, so it does not necessarily improve PAE.
The trade-off also depends on architecture. Doherty designs and envelope tracking can improve efficiency at backed-off operating points without requiring the signal peaks to be driven into saturation.
When Is Operating in Saturation Acceptable?
Saturated operation can be acceptable when the system tolerates the resulting amplitude and phase distortion and still meets its spectral, thermal, and reliability requirements.
Signal or Stage | Operating Implication |
Amplitude-varying communications signals, such as QAM or OFDM | Validate a linear RF amplifier against the waveform’s distortion limits at the required power. Psat alone cannot establish suitability. |
Suitable constant-envelope transmit signals | Operation near saturation may be acceptable after phase behavior and unwanted emissions are verified. |
Receiver gain stages | Maintain headroom for wanted signals and blockers. Saturation generally compromises reception and should not serve as an efficiency strategy. |
Some radar and pulsed transmitters use saturated PAs successfully, while others require tightly controlled pulse envelopes and phase accuracy. Neither the application label nor pulsed operation alone establishes that saturation is suitable.
How Much Output Back-Off Does Your Signal Need?
Use enough back-off to meet the intended waveform’s measured distortion limits. There is no universal setting. With power levels expressed in dBm, saturation-referenced output back-off is:
For the earlier hypothetical amplifier with +32 dBm Psat, consider a required +24 dBm average output and an intended waveform with 8 dB peak-to-average power ratio (PAPR):
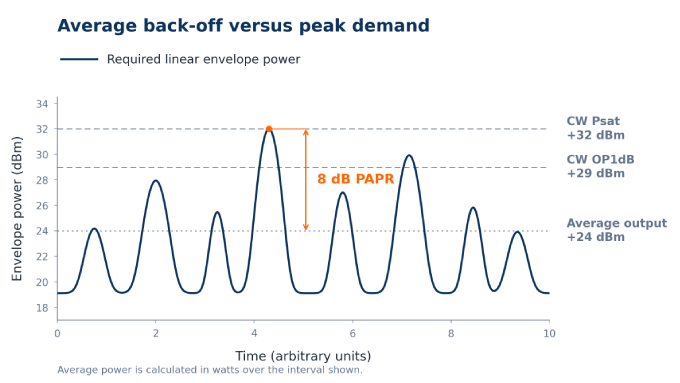
The desired undistorted peaks reach the stated saturation level despite the average-power back-off. This is a screening calculation, not a prediction of the actual compressed output peaks. Validate the required error vector magnitude (EVM), adjacent-channel leakage ratio (ACLR), intermodulation, or other waveform limits using the actual signal.
If headroom is insufficient:
Reduce drive or redistribute gain so one stage does not limit the chain.
Select an amplifier with greater linear output capability.
Manage blockers before the limiting receiver stage. Input attenuation may help, but it also reduces receiver sensitivity.
Apply these checks across the operating band for broadband designs, including distributed RF amplifiers; wide bandwidth does not guarantee adequate power headroom at every frequency.
FAQ
Discussion (0)
Be the first to comment.